In the old days of monoliths, debugging was easy: you SSH'd into the server and checked var/log/syslog. Today, a single user request might touch 20 microservices, 5 databases, and 3 queues. If the user says "It's slow," where do you look?
Monitoring vs. Observability
- Monitoring tells you when something is wrong. "Alert: CPU is at 99%." It answers "Known Unknowns" (things you knew to look for).
- Observability allows you to ask why it is wrong. "Why is payment processing taking 5 seconds only for iOS users in Germany?" It answers "Unknown Unknowns."
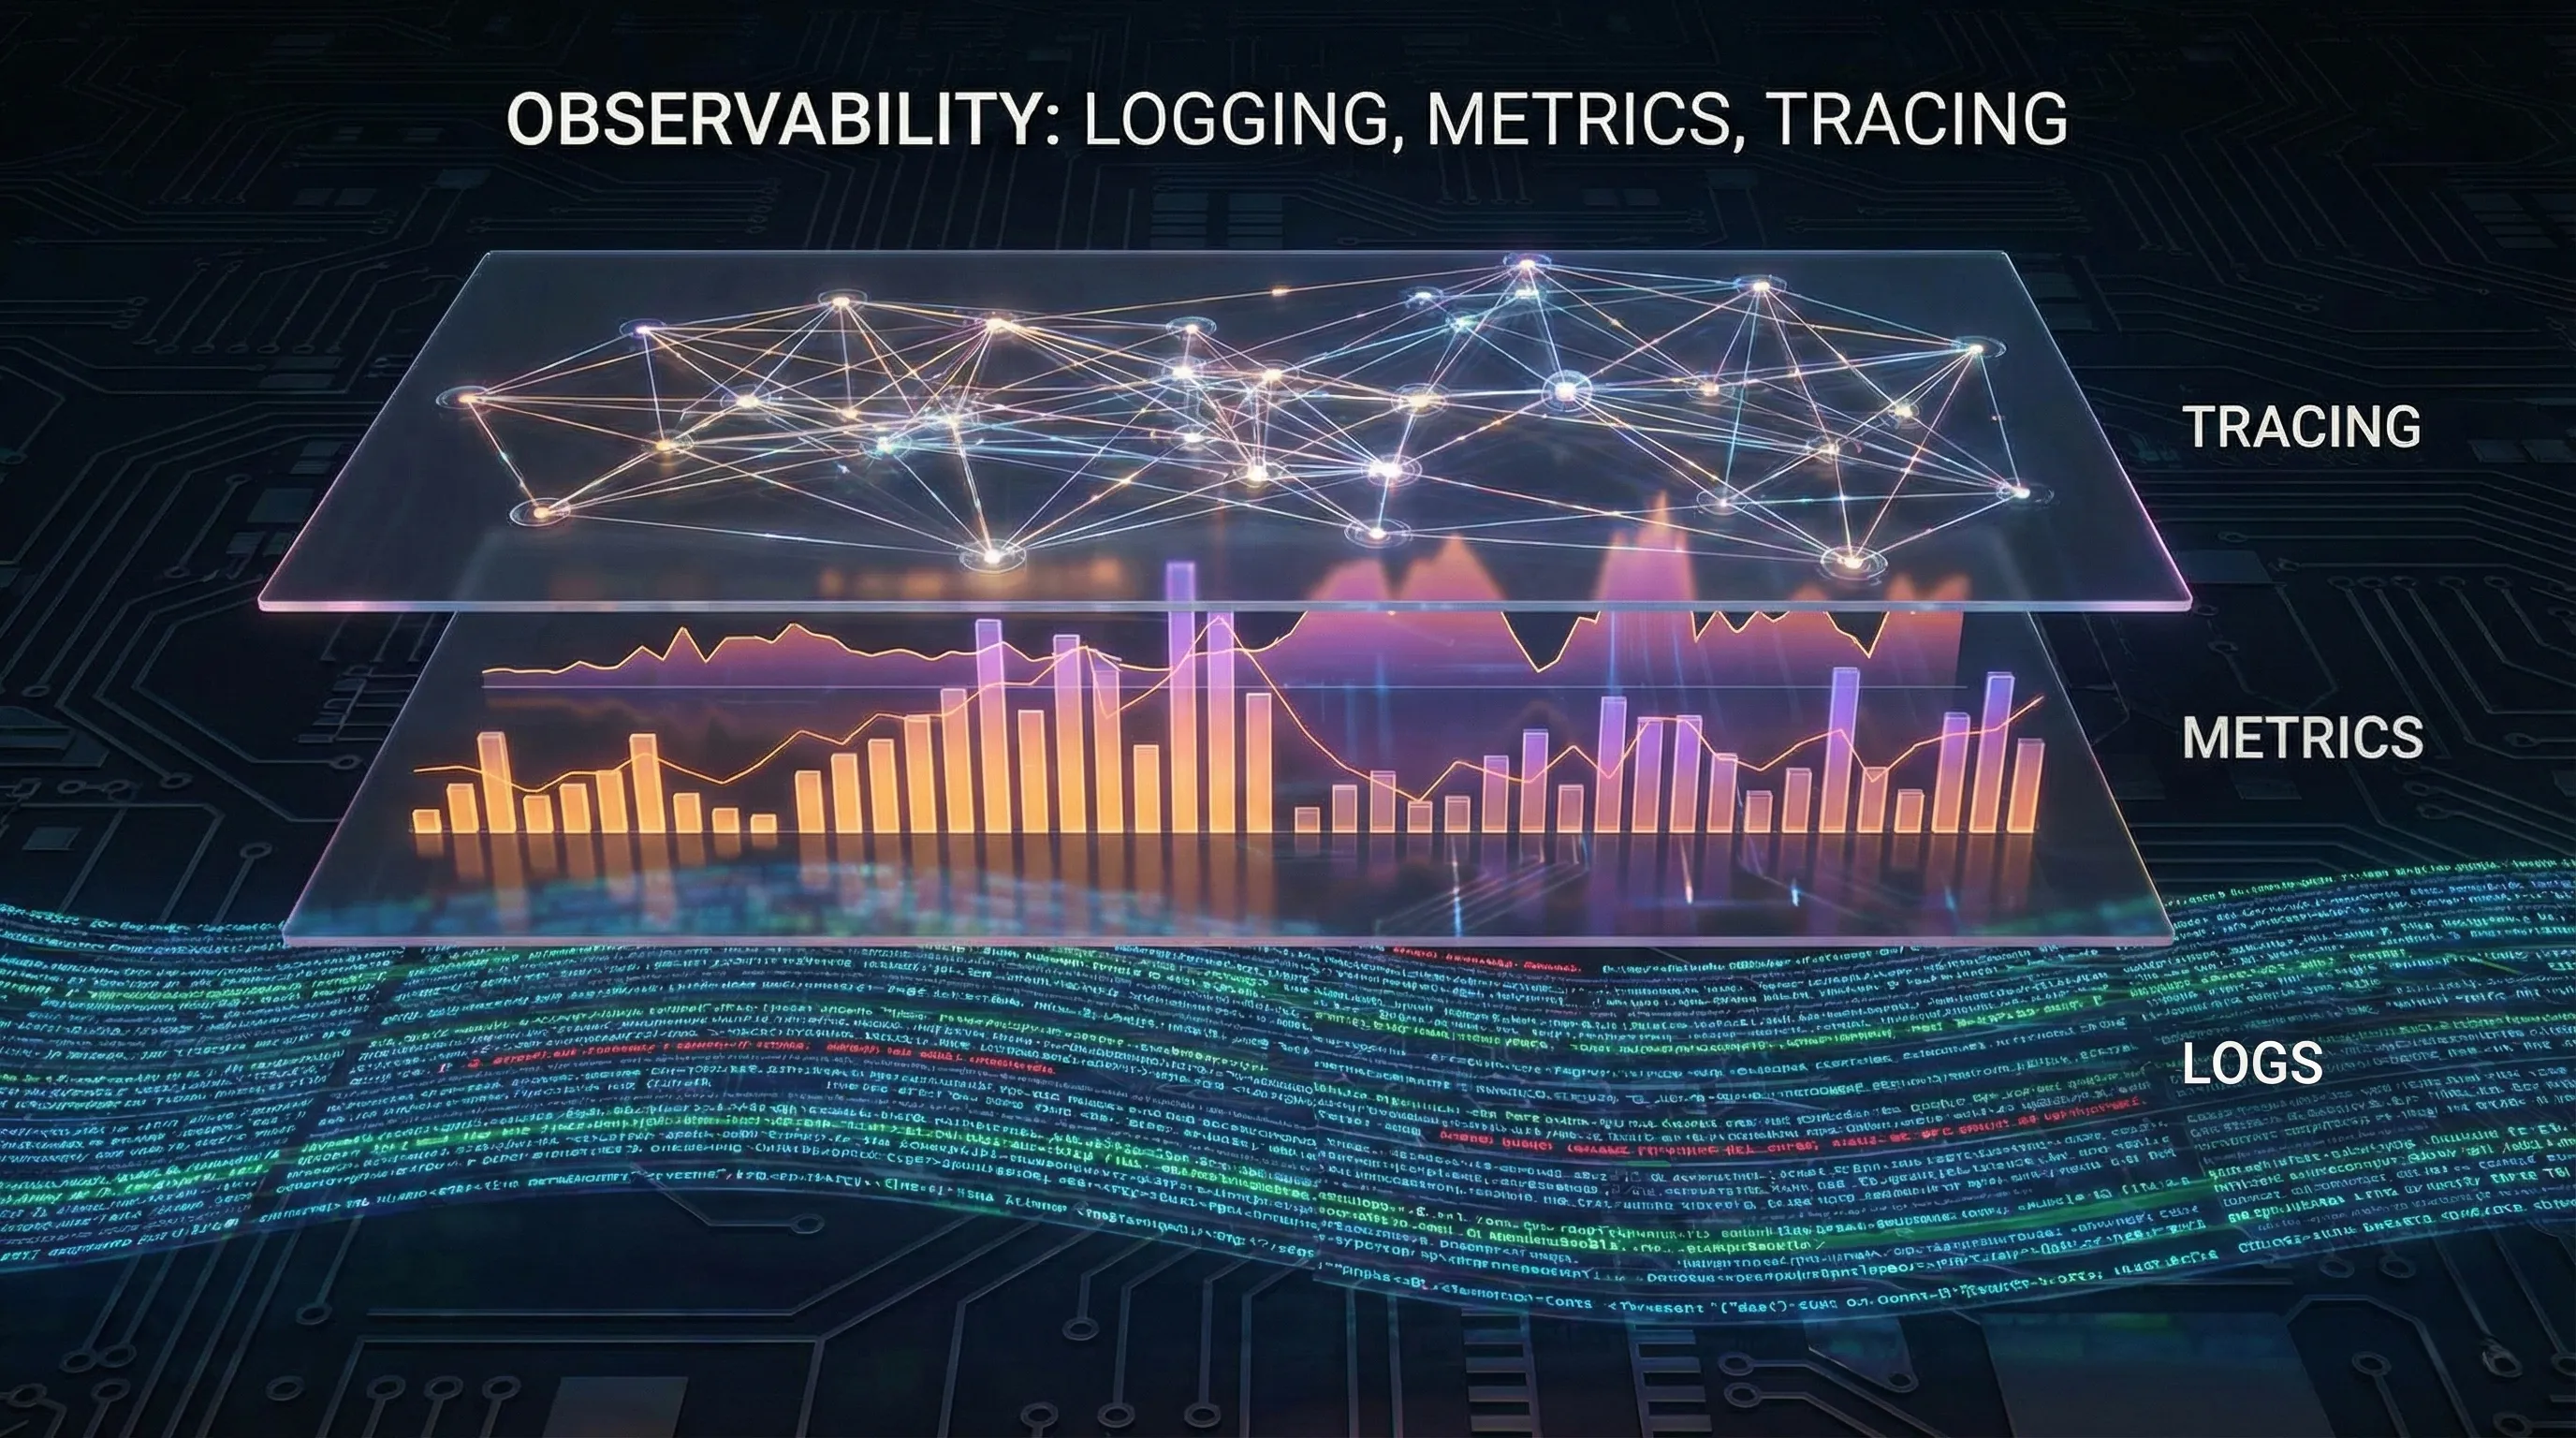
The Three Pillars (and how they connect)
1. Metrics (The "What")
Numeric data measured over time.
- Use for: Holistic health, SLIs/SLOs, and triggering alerts.
- Golden Signals: Traffic, Latency, Errors, Saturation.
- Tools: Prometheus, Grafana, Datadog.
2. Tracing (The "Where")
The lifecycle of a request as it traverses your distributed system.
- Context Propagation: A "Trace ID" is generated at the ingress (Load Balancer) and passed to every downstream service.
- Spans: Each unit of work (e.g., "Query Database", "Call Auth Service") is timed.
- Tools: Jaeger, Tempo, Honeycomb.
3. Logging (The "Why")
Detailed, discrete events.
- Use for: Forensic details when you've already narrowed down the problem via metrics and tracing.
- Best Practice: Structured Logging (JSON) to make them queryable.
The Holy Grail: Correlation
True observability isn't just having these tools; it's linking them.
- Alert fires: "High Error Rate" (Metric).
- Click graph: Jump to the specific Trace IDs that failed (Exemplars).
- View Trace: See the request failed at the "Payment Service".
- View Logs: Jump to logs for that specific service and Trace ID.
- Root Cause: "Database Connection Timeout."
OpenTelemetry (OTel)
The industry is coalescing around OpenTelemetry, a vendor-neutral standard for generating and collecting this data. Instead of locking yourself into a specific vendor's agent, you instrument with OTel and can send the data anywhere (Prometheus, Splunk, New Relic) without rewriting code.
MonitoringObservabilityDevOps
Share: